Chief Operating Officer Dashboard
The Chief Operations Officer (COO) Dashboard can help track, evaluate and optimize your company's operations.
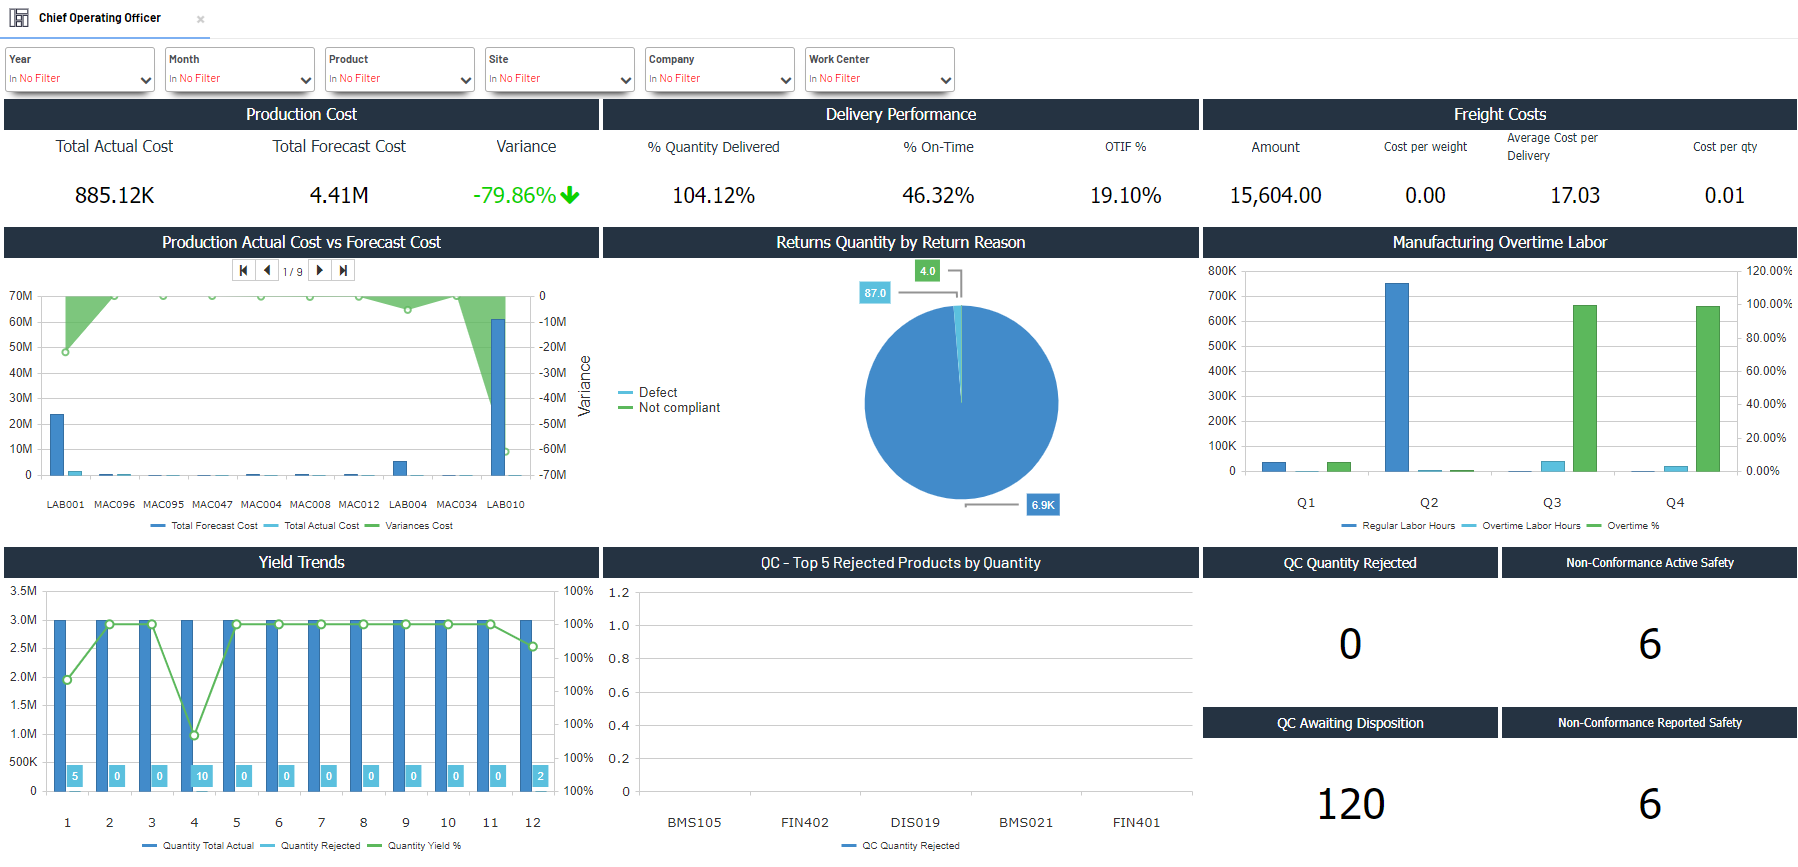
Key metrics at a glance:
-
Production Cost vs Forecast Cost: This section provides a visual representation of the variance between actual and forecasted production costs.
-
Delivery Performance: This section tracks metrics such as on-time delivery rate and quantity delivered. While these metrics might be more relevant to a warehouse manager, they can also be useful for the production manager to understand how production output impacts delivery performance.
-
Freight Costs: This section tracks the cost of shipping produced goods.
-
Manufacturing Overtime Labor: This metric tracks the amount of overtime labor used in production. High overtime labor costs could indicate inefficiencies in the production process or capacity constraints
Benefits of this dashboard:
-
Improved communication: The dashboard can be used to communicate performance data to all stakeholders in the organization, which can help to ensure that everyone is working towards the same goals.
-
Better decision-making: By having all of the relevant data in one place, COOs can make more informed decisions about how to allocate resources and improve efficiency.
-
Increased efficiency: The dashboard can help to identify areas where processes can be streamlined and costs can be reduced.
Filtering
You can filter the dashboards using these filtering panels:
-
Year
-
Month
-
Product
-
Site
-
Company
-
Work Center
Global Variables
The Manufacturing Overtime and Regular Labor hours KPI is based on the newly created fields in the GL Transaction details data model. These fields are based on the Account code for Labor hours that are set in the Global variables @@LaborRegular and @@LaborOvertime. These global variables must be populated in order to use this KPI correctly.